Who America complains about.
Sixteen million consumer complaints to the CFPB. Three companies generate most of them, almost none end in the consumer's favor, and the volume is growing faster than anyone can staff for. A map of where financial compliance is failing, drawn from the public record.
The Figures
Findings
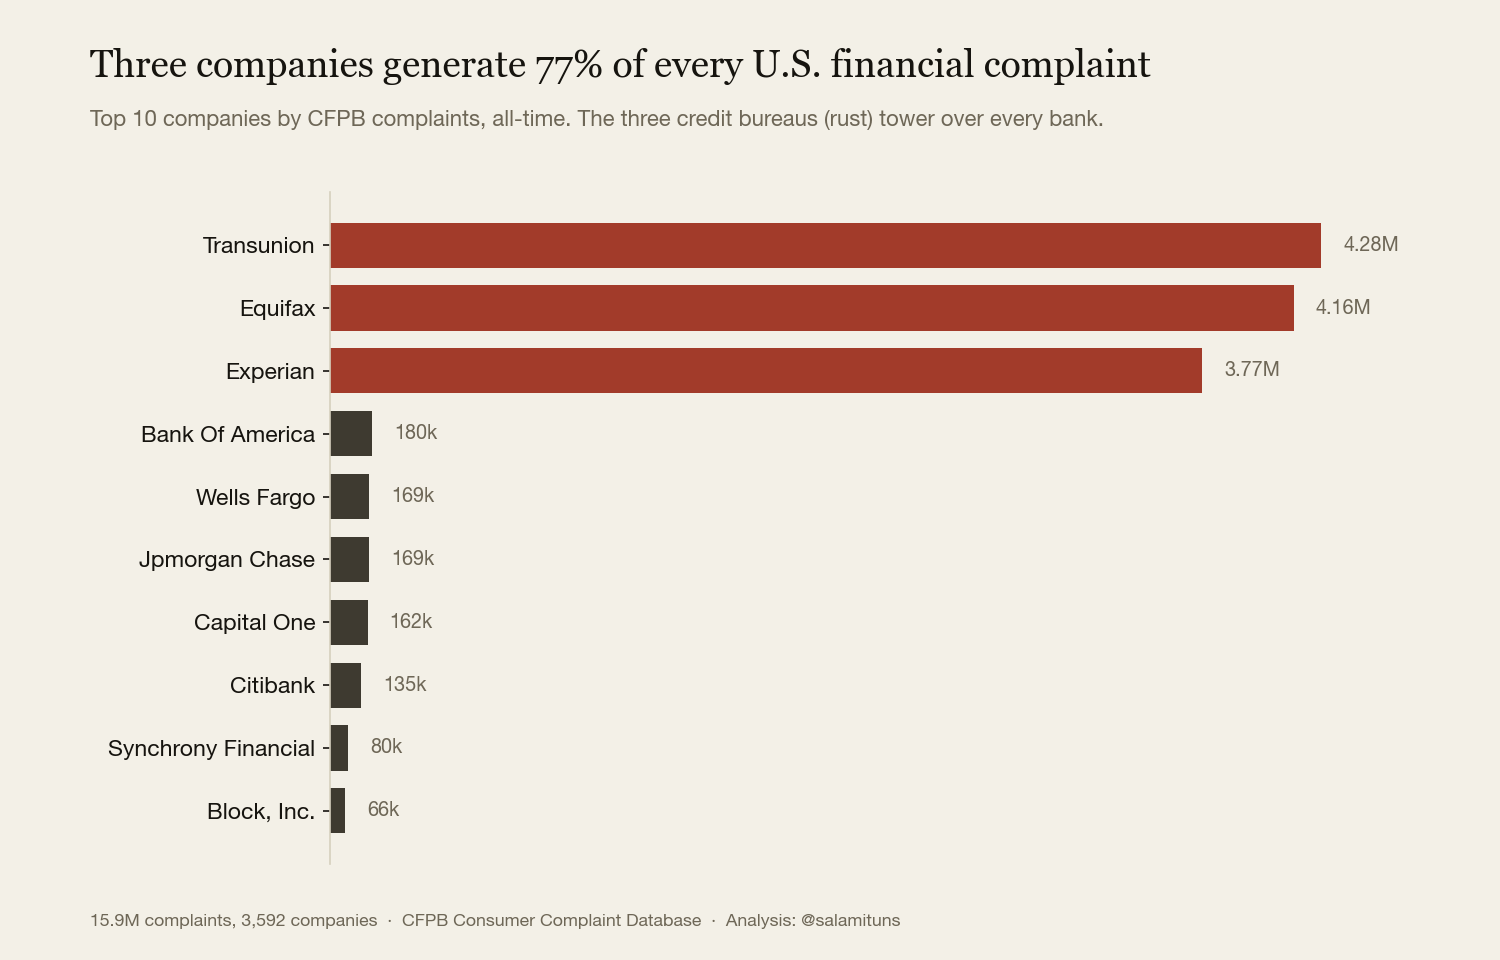
Three companies, 77% of the complaints.
TransUnion, Equifax, and Experian, the three credit bureaus no consumer chooses to do business with, generate more than three-quarters of every financial complaint Americans file. The next 3,589 companies share what is left. The cliff between the bureaus and the largest banks is an order of magnitude wide.
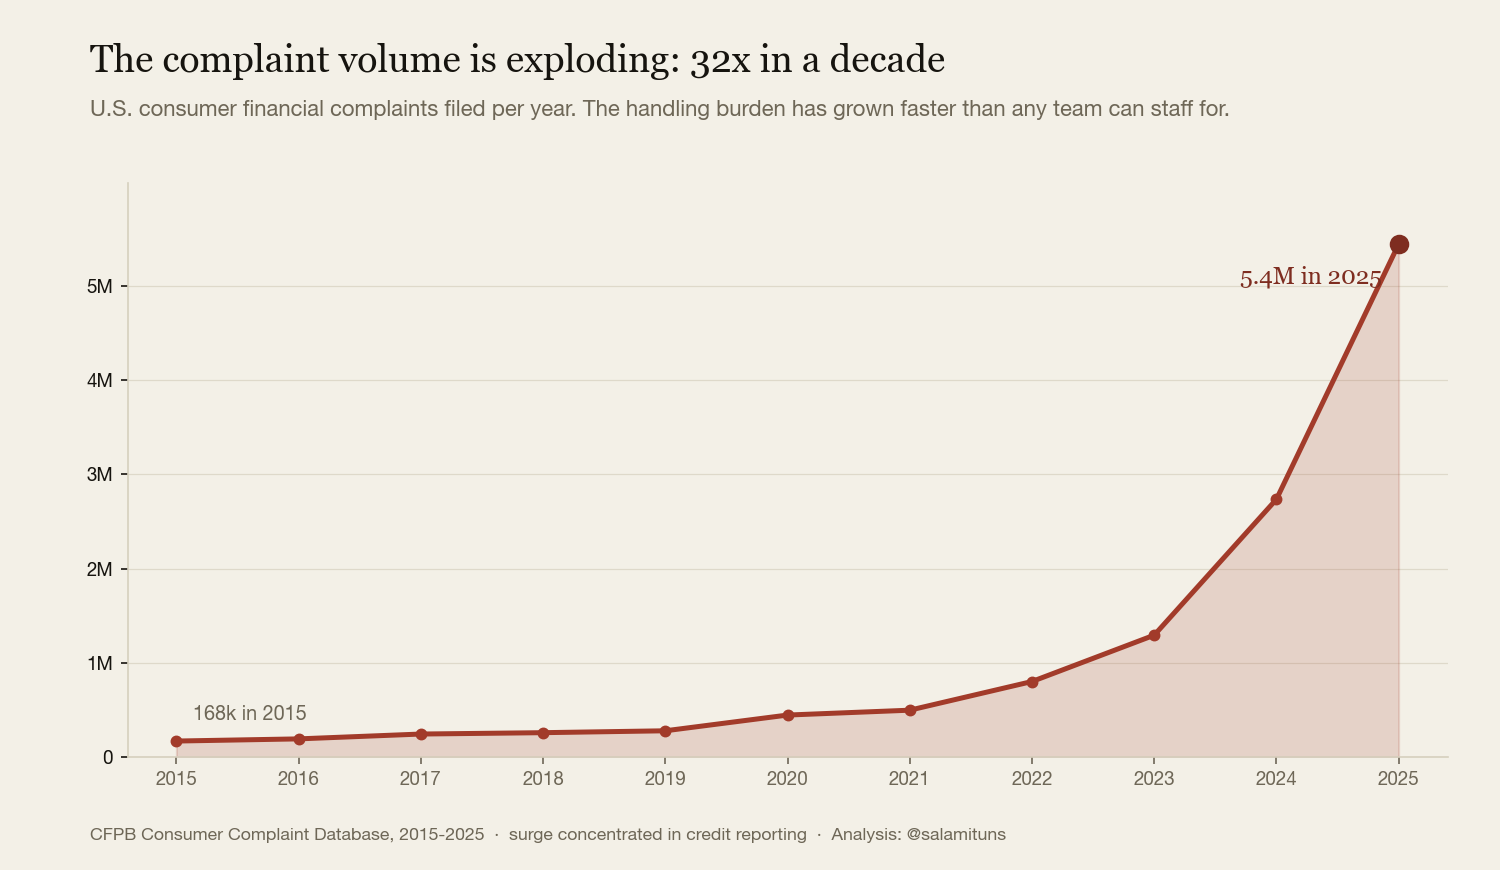
The volume is exploding.
168,000 complaints in 2015. 5.4 million in 2025. A thirty-two-fold rise in a decade, with the steepest climb in the last three years. Whatever a compliance team was sized for in 2018, the inbound has outrun it.
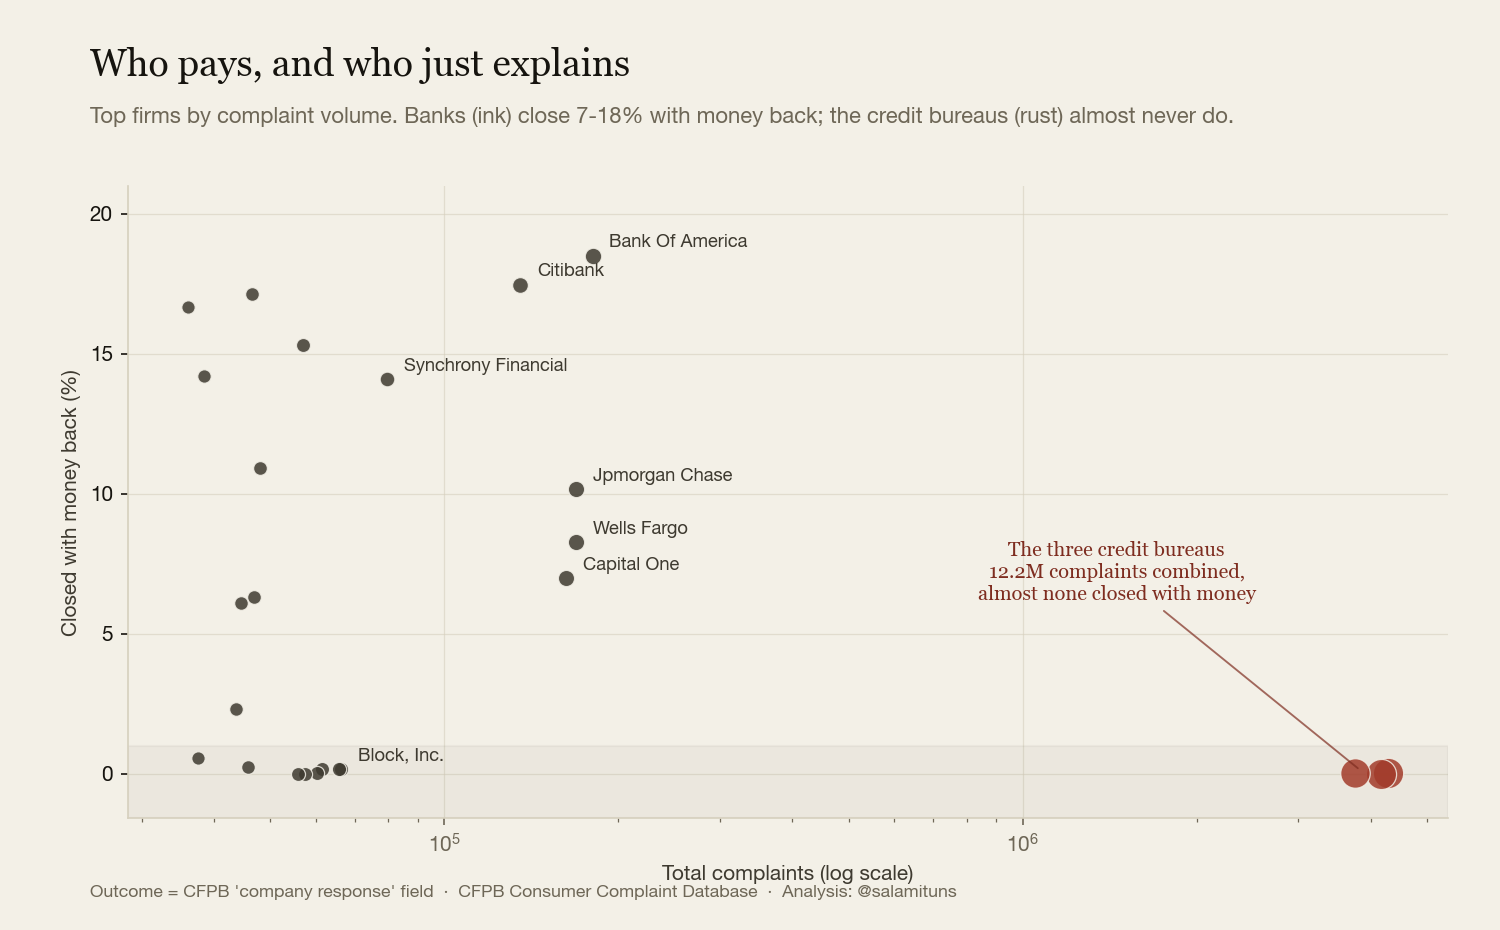
Who pays, and who just explains.
Plot every top firm by complaint volume against how often it closes a complaint with money back. The banks (Bank of America, Citibank, Chase) sit at 7 to 18 percent. The three credit bureaus, with twelve million complaints between them, sit at essentially zero: they correct the record, they rarely pay. A few high-volume fintechs and collectors sit in the same dead zone.
A regulator's first case file is written by the public.
The compliance read
If you own compliance or risk at a financial firm, this dataset is describing your exposure in public. Complaint concentration, the relief gap, and the response-quality signal are the same indicators the CFPB ranks firms by, and they move before an enforcement action does.
Tareony builds the software that turns that signal into something you act on: complaint and obligation tracking, automated handling, and audit-ready reporting in your regulator's language. We have built it for healthcare (Protexa) and as an industry-agnostic compliance engine (Kletraq). If you want your own exposure mapped, your handling automated, or the reporting built into software, then we should talk.
Data
- CFPB Consumer Complaint Database
- Every consumer complaint submitted to the Consumer Financial Protection Bureau, all-time through 2025, with company, product, state, response, and timeliness fields.
Method
Figures are built from the CFPB public API's facet aggregations, not raw rows: company, state, product, company-response, and timeliness counts pulled directly, so the analysis is small and reproducible. Per-company response quality was queried company by company for the top firms. Year totals are date-filtered counts.
One honest caveat: the post-2022 surge is concentrated in credit-reporting disputes, a large share of them filed in bulk through credit-repair services. The volume is real and firms must still handle it, but it is not evenly distributed across products. Charts are rendered in Python (matplotlib) in the editorial palette; the pull and figure code are reproducible.
Nothing here is a proxy for causation. What the data shows is concentration, trend, and outcome, the public-record signal that precedes regulatory attention.