Six companies, six months.
New Mexico requires 98% natural gas capture by December 31, 2026, and it enforces the line through the thing an operator needs most: permission to drill the next well. Four years of public C-115 filings show a field converging on compliance ahead of schedule, and a small tail that has not.
If you operate in New Mexico, your capture rate is not a sustainability metric. It is a license condition, computed from the filings your own office submits every month.
The Figures
Findings
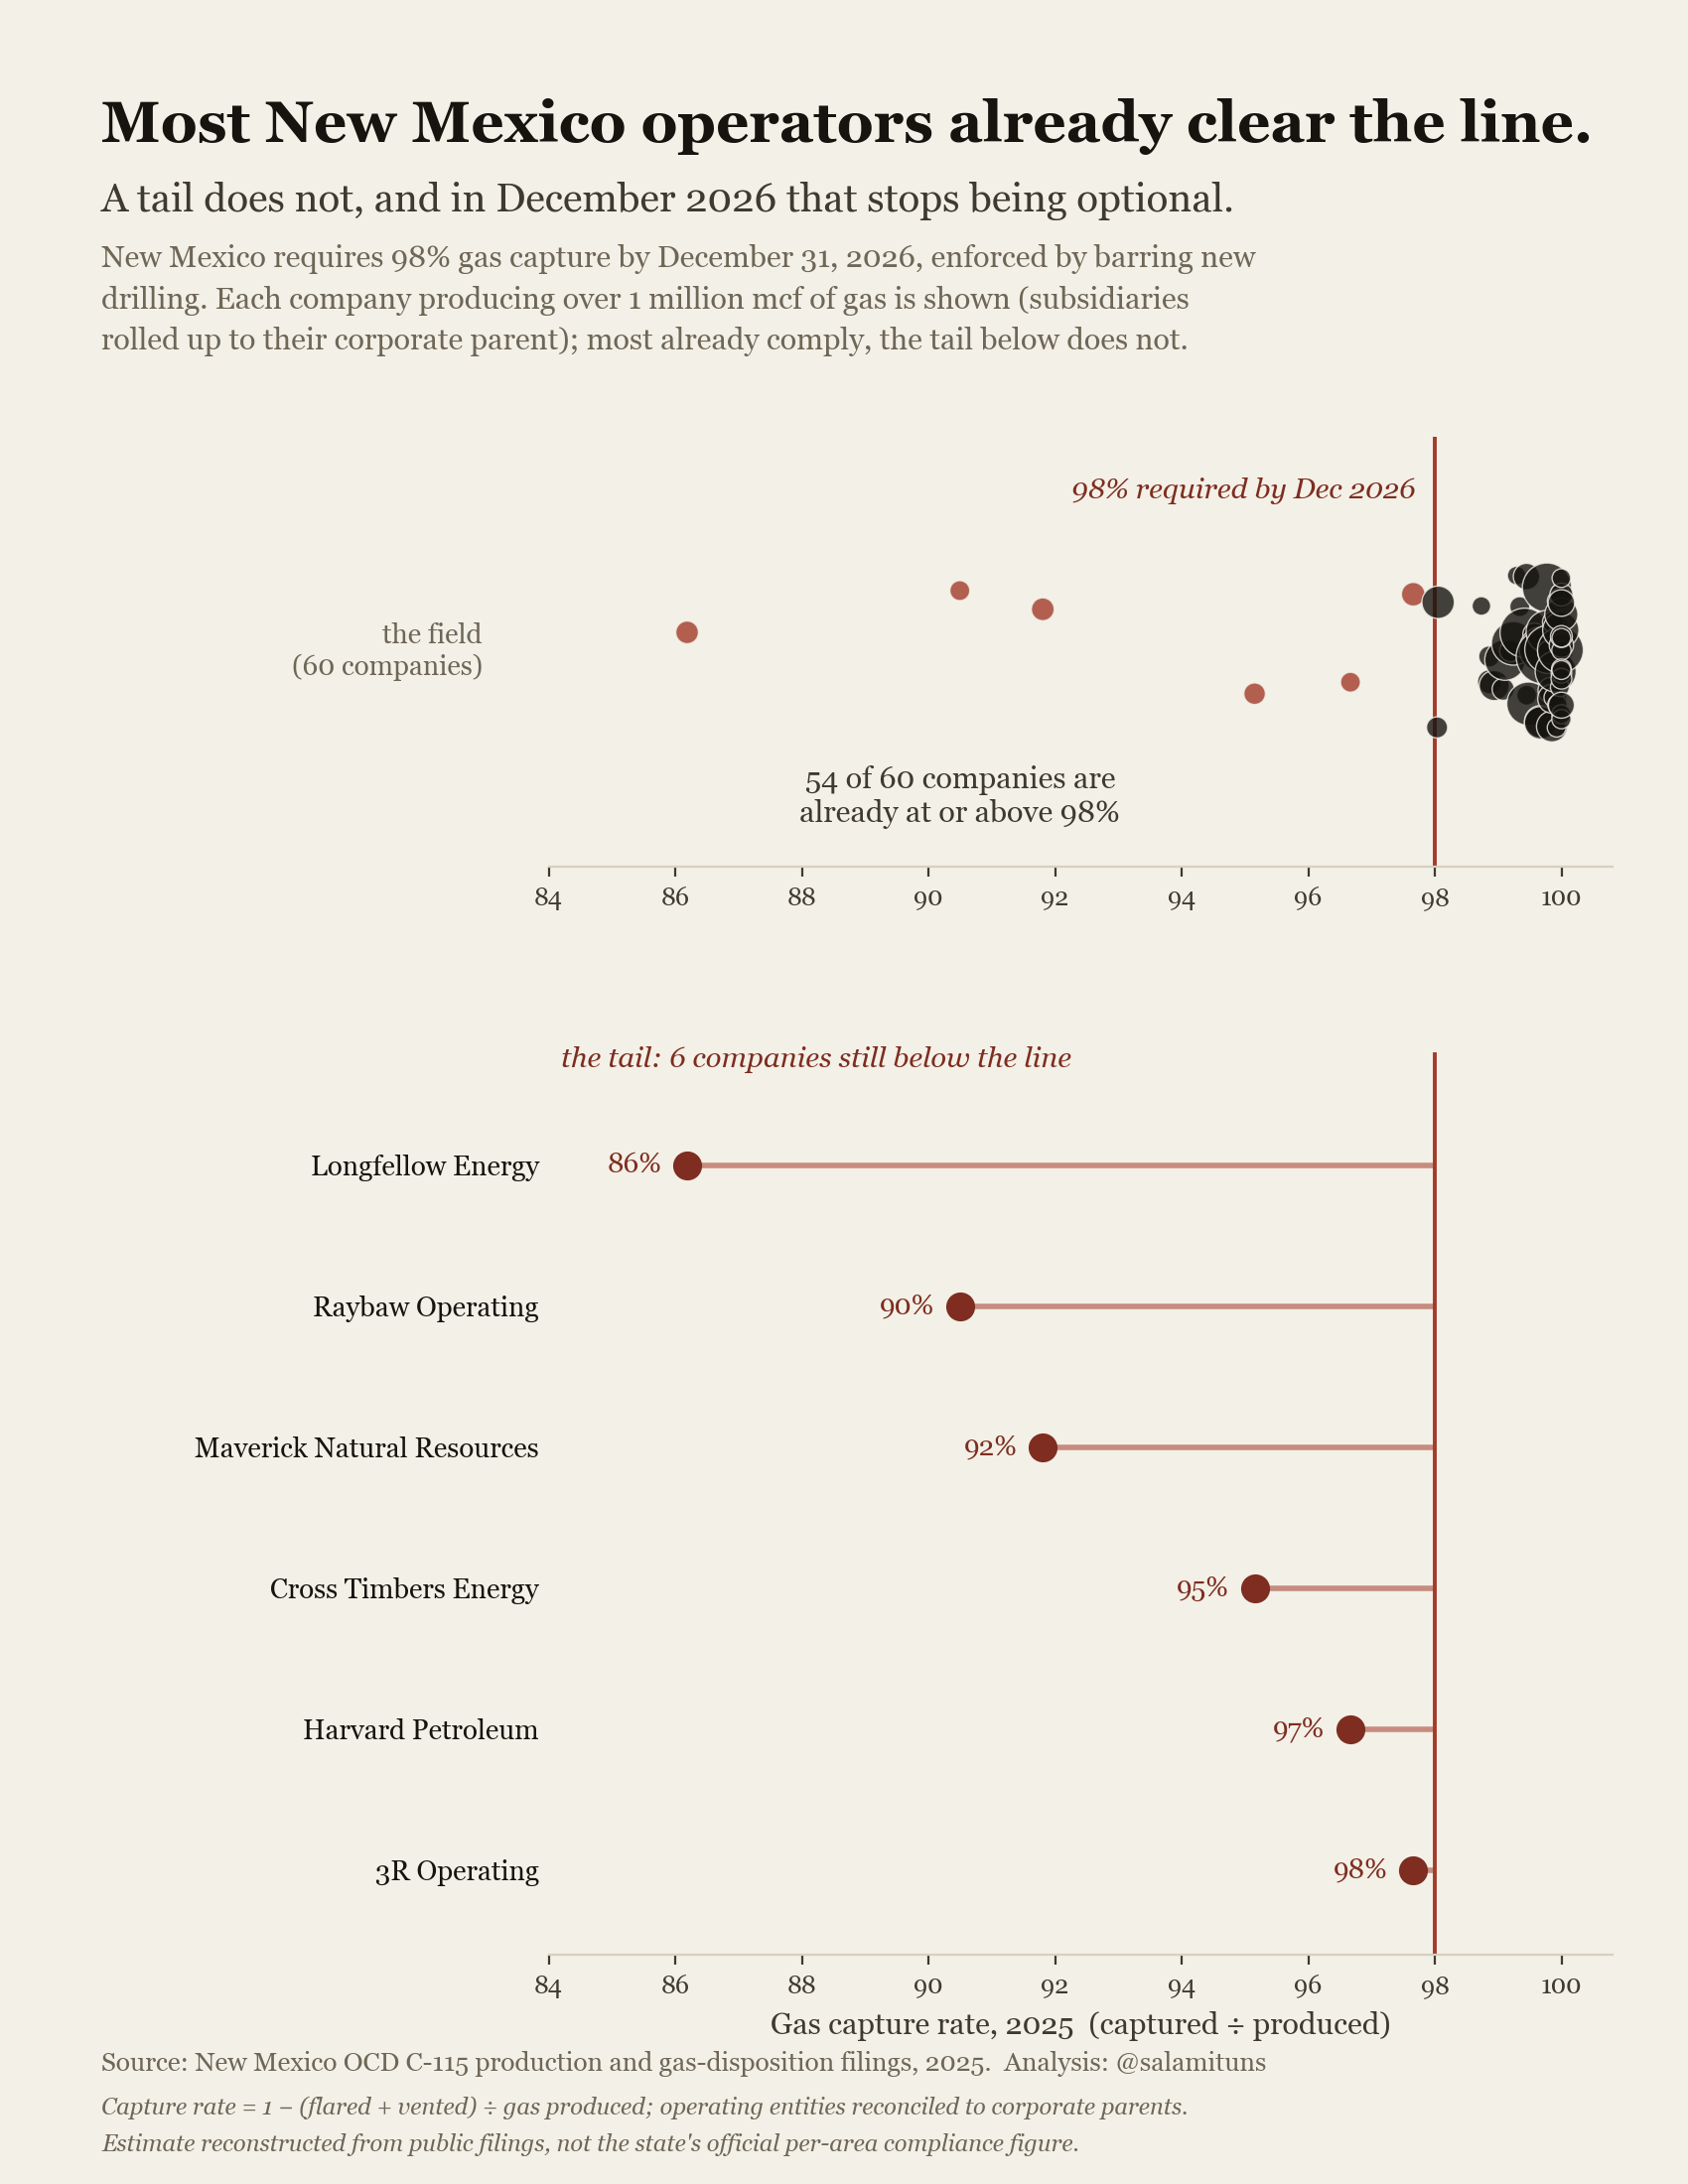
Most operators already clear the line.
Every company producing over one million mcf of New Mexico gas in 2025, subsidiaries rolled up to their corporate parent. Fifty-four of sixty are at or above 98% capture. The six below the line are named, because the state’s own filings name them: from Longfellow Energy at 86% to 3R Operating within half a point of compliance.
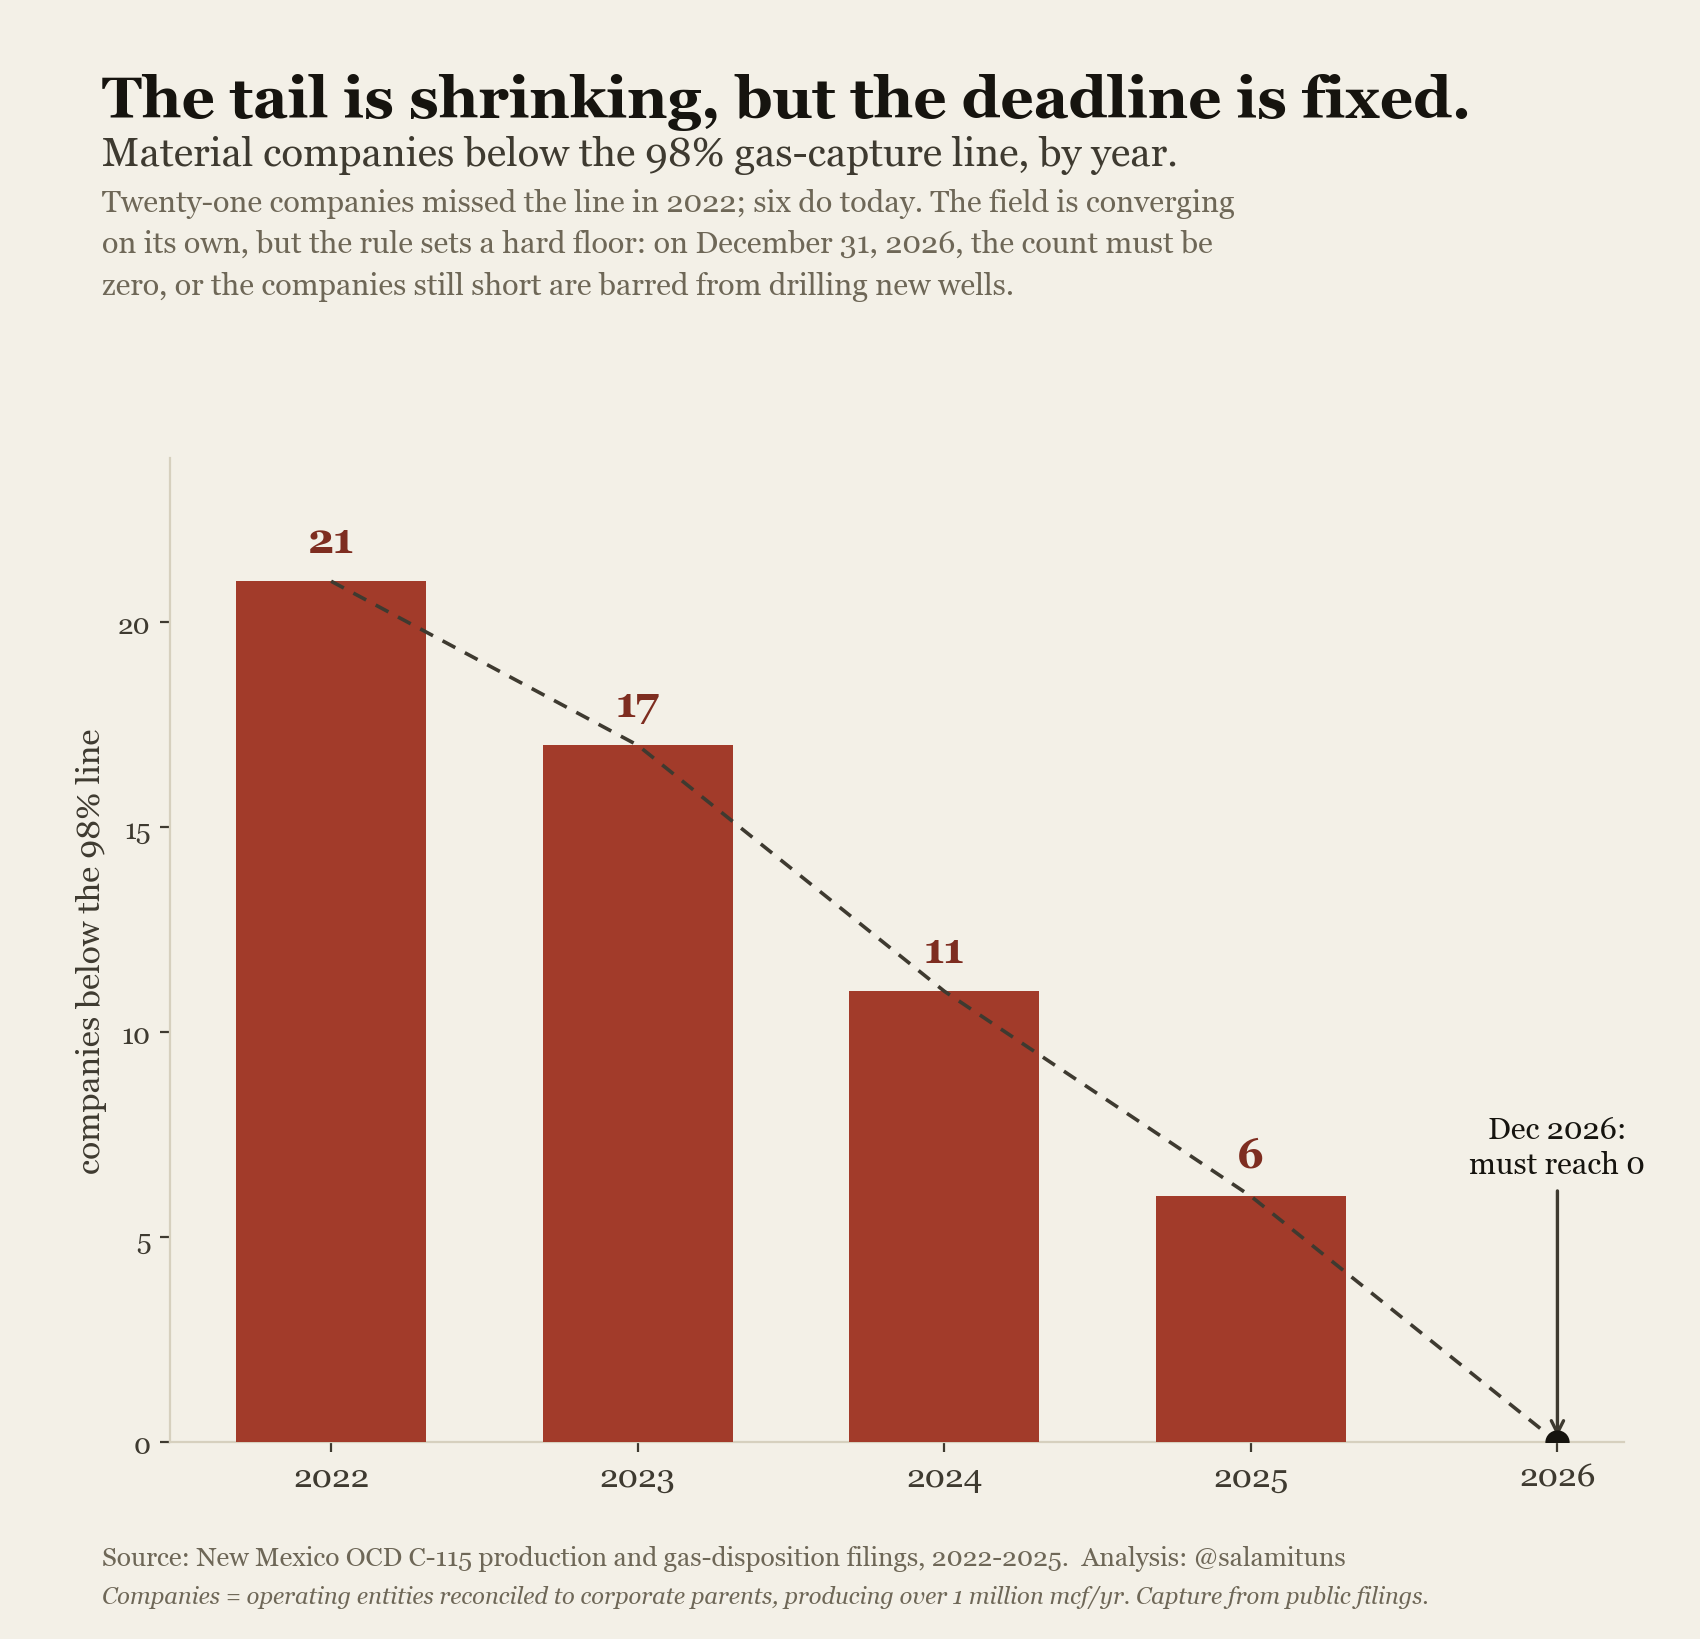
The tail is shrinking, but the deadline is fixed.
Twenty-one material companies missed the line in 2022. Seventeen in 2023, eleven in 2024, six in 2025. The field is converging on its own, which is what a phased rule with teeth is designed to produce. But the phase-in ends: on December 31, 2026 the count must be zero.
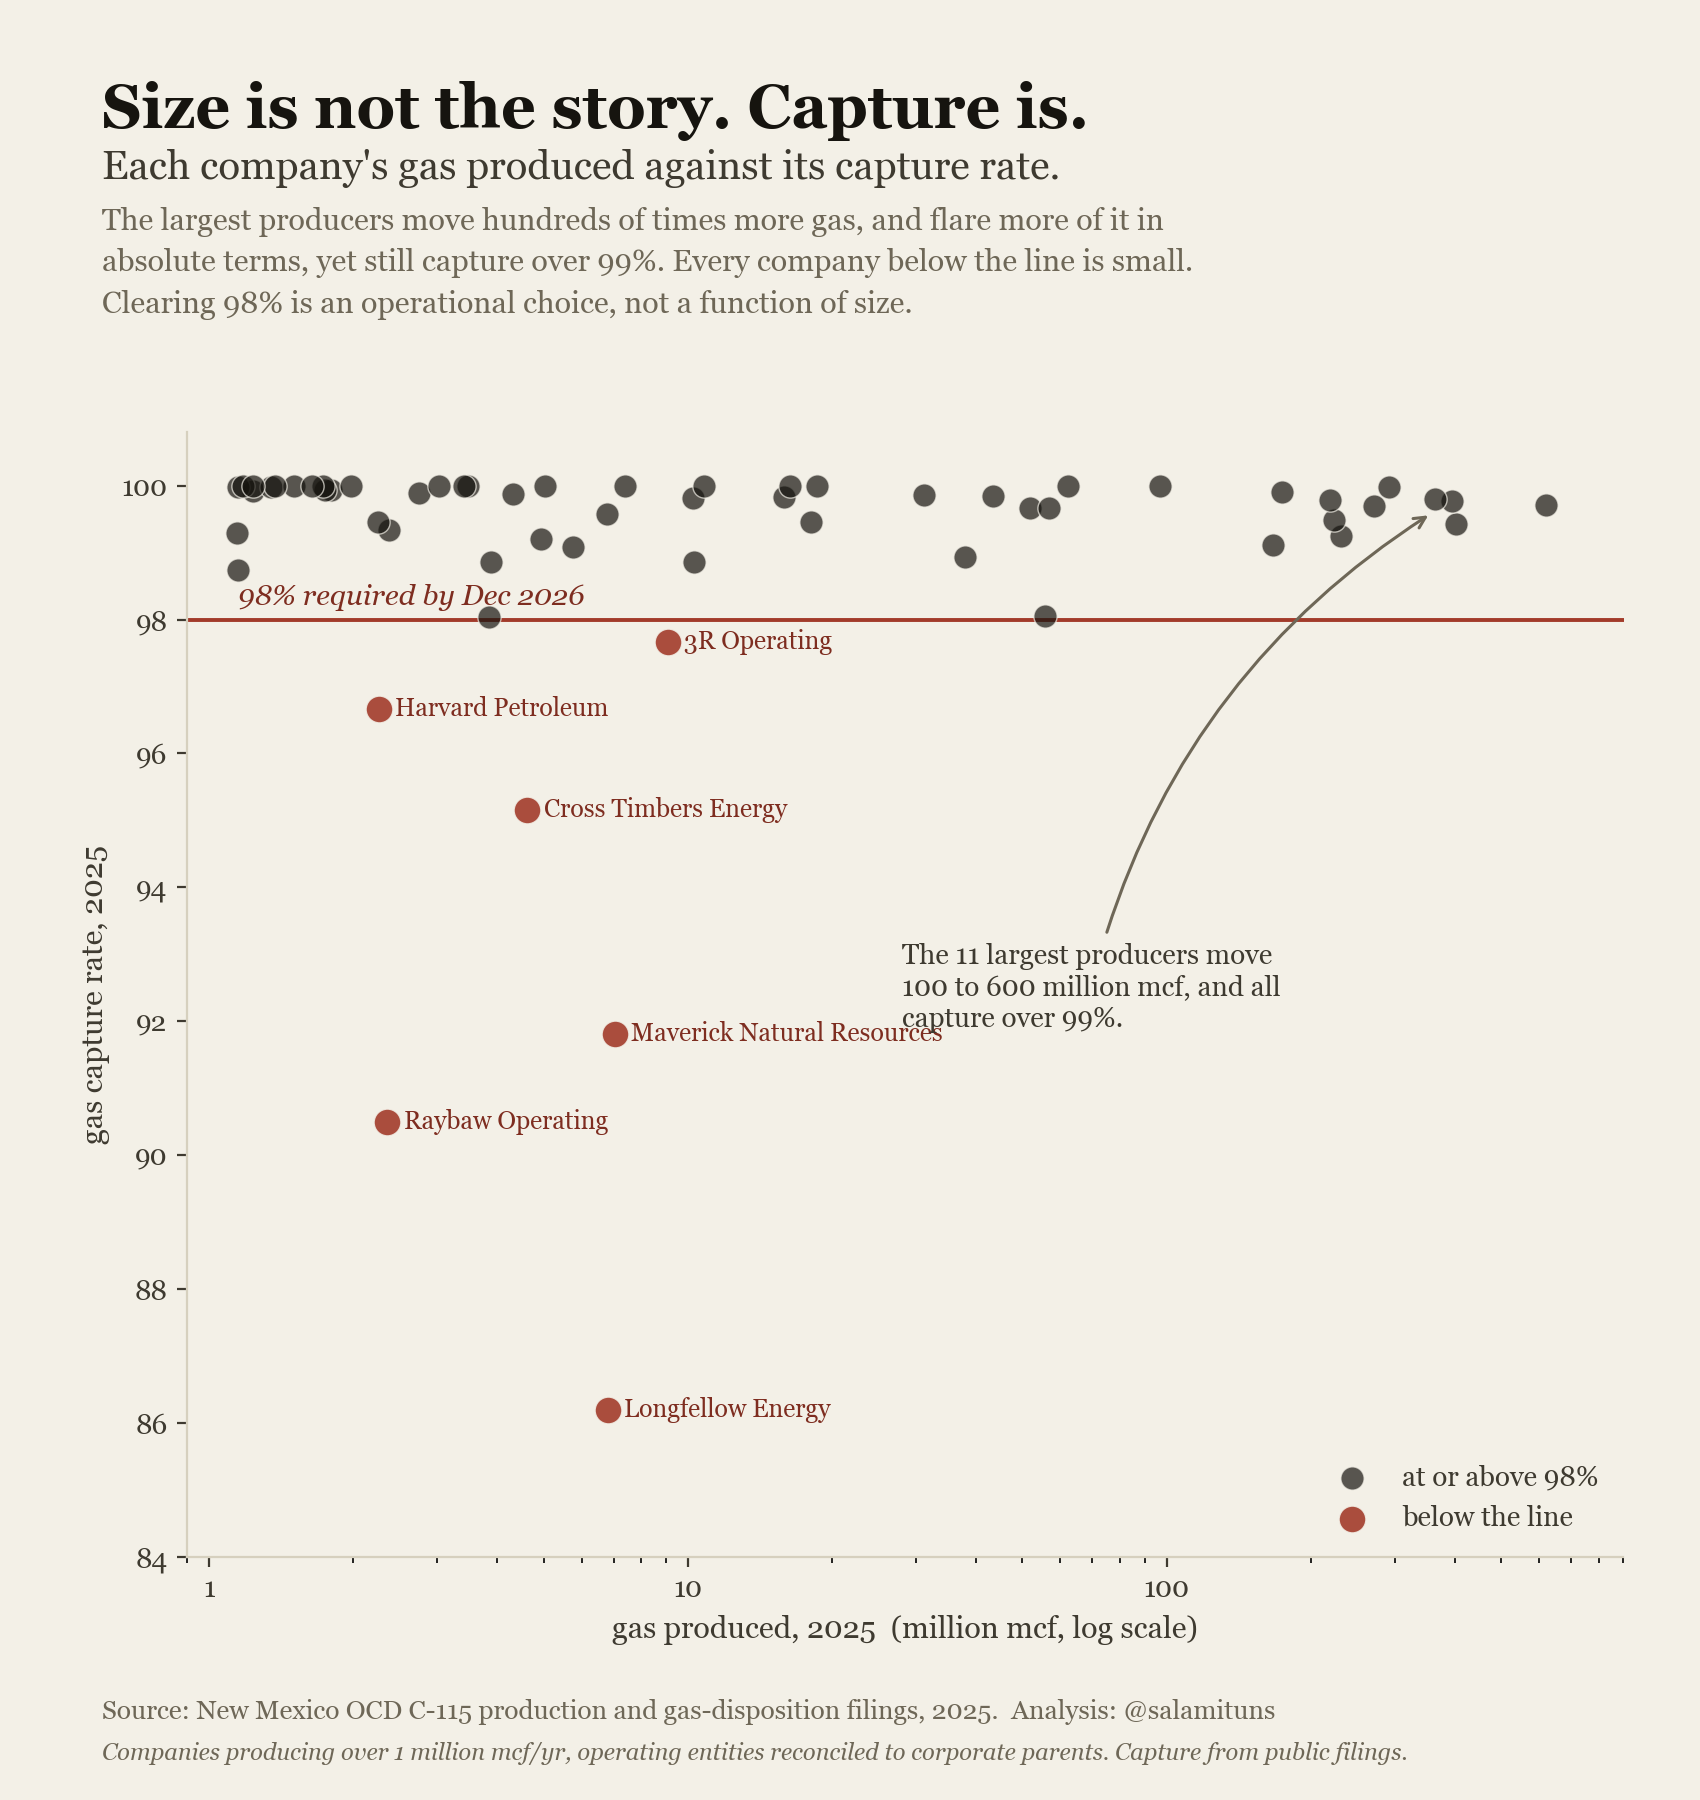
Size is not the story. Capture is.
Plot every company’s gas produced against its capture rate and the pattern is unambiguous: the eleven largest producers move 100 to 600 million mcf apiece and all capture over 99%. Every company below the line is small. Clearing 98% is an operational choice, not a function of size.
The enforcement mechanism is the next drilling permit.
The operations read
If you run production, regulatory reporting, or compliance at a New Mexico operator, everything on this page was computed from filings your office already submits: C-115 dispositions on the numerator, C-115 production on the denominator. The state runs the same arithmetic, per reporting area, against your baseline. Which means your capture number is knowable months before it is enforceable, from data you already have.
The work between 96% and 98% is rarely a mystery of engineering. It is metering gaps, misclassified dispositions, unreconciled transfers between operated entities, and month-end numbers assembled by hand. That is data work with a deadline, and it is the kind Tareony does: consolidate the filings, compute the rate the way the rule computes it, and put the exceptions in front of the person who can fix them while there is still calendar left.
Data
- NM OCD C-115 flaring & venting disposition data
- Operator-year volumes of non-transported gas by disposition (flared, vented, lost, used on lease, gas lift, repressurizing) from 2014, published by the New Mexico Oil Conservation Division.
- NM OCD production by operator
- Annual natural gas production by operator (OGRID), the denominator for the capture rate.
Method
The capture rate here is 1 − (flared + vented) ÷ gas produced, per corporate parent, per year, joining the C-115 disposition table to production on the operator’s OGRID. Operating entities are reconciled to parents by a reviewed crosswalk (for example, Maverick Permian and Breitburn Operating roll up to Maverick Natural Resources). The headline ranking applies a materiality floor of one million mcf produced per year, so small operators’ noisy ratios do not dominate the tail. Companies are ranked by rate, never by absolute volume: the largest producers flare the most gas in absolute terms and still capture over 99%.
The honest caveat, stated plainly: this is an estimate reconstructed from public filings, not the state’s official compliance figure. The rule (19.15.27.9 NMAC) computes capture per reporting area, north and south of Township 10 North, against each operator’s baseline and annual increment, with specific inclusions and exclusions. Our statewide-per-parent reconstruction reproduces the state’s published aggregate for 2025, which validates the method at the field level, but any individual company’s official number can differ from the estimate shown here. If yours does, the method and data above are open; we would rather correct a figure than defend one.
Enforcement, precisely: an operator that misses its annual capture target must submit a compliance plan to EMNRD demonstrating its ability to comply in the current year. If the division determines the plan does not demonstrate that ability, the operator’s approved drilling permits for wells not yet spudded are suspended. Processing in Python (pandas); figures are matplotlib in the editorial palette; the parse, join, and figure code are reproducible.
From the studio
Everything above was reconstructed from the outside, from public filings. If you own this number on the inside (production accounting, the C-115 chain, the reconciliation between field data and what the state sees), you can know where you stand against the line months before the state tells you, and fix the data problems that masquerade as capture problems while there is still 2026 left.
Most engagements begin with a fixed-scope analysis sprint, two to six weeks. Start a conversation →